Team Members:
Anna Bonatz, Daniel Gordon, Harry Nagi, Katherine Paton-Smith, and Mitchell Zwecker
Motivation
Twitter is a social media application that allows you to post anything within its character limit. It has a great deal of information with many news platforms allowing us to see, and hear, what is happening in our world within seconds. And Elon Musk is a CEO who is well known for his erratic, often controversial tweets. We want to figure out if there is a correlation between the language sentiment or the use of certain words in Elon Musk’s tweets and the fluctuation of Tesla stock prices. If there is, this could provide information about how C-suite employees like Musk tweeting affects stock prices so that companies can use Twitter to their advantage
While not specifically related to Elon Musk’s tweets, many other researchers have done work in this area. Stanford students used Twitter sentiment analysis and machine learning algorithms to find the correlation between “public sentiment” from all tweets on Twitter, to “market sentiment,” or the general state of the stock market. They found a general correlation with the degree of “happy” and “calm” moods [2]. Similarly, Slovenian researchers studied the relation of Twitter’s public opinion of companies and their stock prices using the Granger Causality Test and SVM. They found that changes in positive sentiment tweets can predict changes in the stock market [4].
With the recent increase in algorithmic and quantitative trading at both the commercial and retail levels, a model that could predict stock changes in a stock as volatile as TSLA based on its CEOs tweets could be very beneficial in making trading decisions. Additionally such a predictive model could hopefully be extrapolated to other CEO’s tweets and used on a larger scale.
Data Sets
Elon Musk’s Tweets
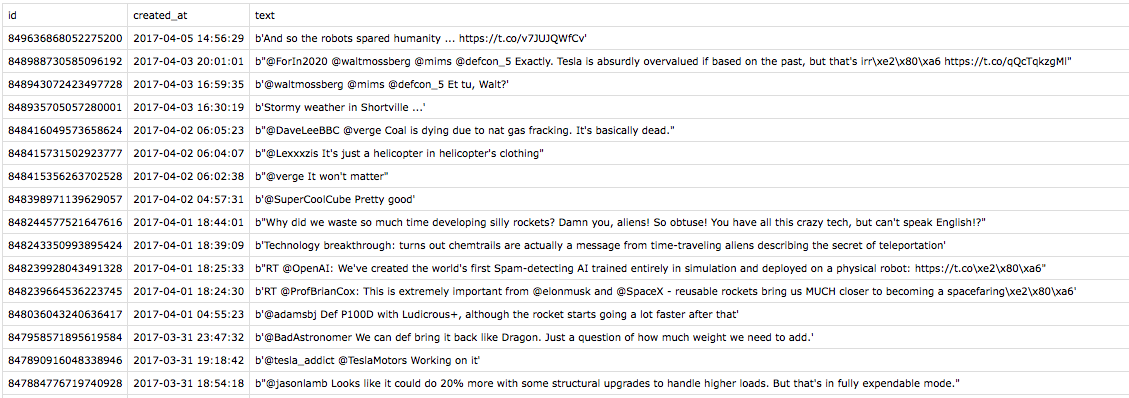
This dataset includes all of Elon Musk’s tweets from 2010 to 2017 [Kaggle Link]. In total there are 2819 tweets. Each tweet is listed by it’s Tweet ID, and the date and time it was posted.

Initial preprocessing of the tweets included removing all URLs and username tags, removing punctuation, and lower-casing the words. We also converted each date and time into just a date. Since the markets close at 4pm, and are closed on the weekends, any tweet made after 4pm were moved to the next day, and all tweets on the weekend moved to Monday.
 processed to

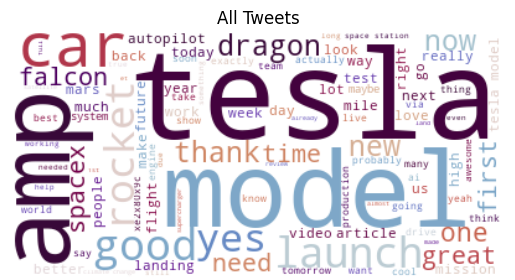
An initial WordCloud shows the 75 most common words in the tweets, after removing common English stop-words. A majority of the tweets are directly related to Tesla, with words such as ‘tesla’, ‘model’, ‘car’, ‘amp’, and ‘autopilot’. Arguably, these tweets will have a larger impact on Tesla Stock prices than tweets about SpaceX, which include words such as ‘spacex’, ‘rocket’, and ‘launch’.

Stock Data
TSLA
This dataset includes TSLA stock data from 2010 to 2020 [Kaggle Link]. There are 2417 days for which this dataset provides the Open, High, Low, Close, Adjusted Close, and Volume of TSLA for that day.
SPY
This dataset includes information about the etf SPY, which tracks the S&P 500 as a whole, from 1993 to 2019 [Kaggle Link]. There are 2372 days for which this dataset provides the Open, High, Low, Close, Adjusted Close, and Volume of SPY for that day. Although TSLA is in the NASDAQ we feel as though the S&P 500 is a better judge of the market as a whole, which is why we wanted to use it rather than the NASDAQ when trying to get the market regulated change of the TSLA stock price.
We first calculated the daily percent change of the TSLA stock price and, in order to try and differentiate TSLA changes from general market fluctuations, we subtracted the daily percent change of the S&P 500 (using a dataset of the etf SPY) to get the market regulated change of the TSLA stock price.
relativeChangeTSLA = percentChangeTSLA - percentChangeSPY
Sentiment Analysis
Splitting the Training and Testing Sets
For the training set, we selected the first 70% (around 2000) of the tweets. Each group member analyzed 400 tweets, assigning a score of -1 (negative), 0 (neutral), or 1 (positive) based on the words in the tweet and the overall feel of the tweet. The testing sets were selected as the tweets not assigned sentiment, which were approximately 30% (around 800) of the tweets. The training set had a distribution as follows:
Classification Algorithm
Multinomial Naive Bayes was used to perform the sentiment analysis. Naive Bayes was only used on tweets that had been processed in order to remove unnecessary words/links and “@s”. Positive, neutral, and negative dictionaries were created to perform this analysis, which separated the tweets into individual words and could get the frequencies of each word for each sentiment. The data was trained with the 2000 tweets identified as the training set, and predictions can then be made using the 800 tweets assigned to the testing set.
Classification Results
A confusion matrix was produced to illustrate the accuracy of our analysis. This matrix was created with our training set, comparing our assigned sentiment values with the values our Naive Bayes algorithm determines for the training set.
From this chart, it can be found that 375 negative tweets, 578 neutral tweets, and 834 positive tweets were classified correctly. 226 tweets are classified incorrectly, giving an accuracy of 88.77%.
Regression
Splitting the Training and Testing Sets
Due to the fact that we only have daily stock price data for both TSLA and SPY and the fact that Elon Musk usually tweets multiple times throughout the day, we averaged the sentiment scores that we got from the Multinomial Naive Bayes classifier for each day to get a daily average sentiment score. We then split this data into training and test sets using 70% (500 days) of the data for training set and the other 30% (260 days) for the test set. Since we had already calculated the change of TSLA (regulated by the change of the market as a whole), we used the 500 days that matched up with the daily average sentiment score for that respective day.
Regression Algorithm
We initially thought that Regression would be the best way to predict the TSLA stock price change, so we ran linear regression with our data. This gave us an r squared value of 0.0001, which indicated that our model did not fit our data well - essentially meaning that it could not effectively tell us the relationship between our daily averaged sentiment scores and our market adjusted daily TSLA stock price change.
We then decided to add more features since we were only predicting based on the sentiment score. The added features were the frequencies of individual words used in Musk’s tweets throughout the day and the number of tweets that Musk tweeted on that specific day. We first ran a simple linear regression with the newly added features. We plotted the difference between the actual TSLA stock price change and the predicted TSLA stock price change for the test set, and the resulting plot illustrates that the model does not predict the TSLA stock price change well.
Classification
Since the inclusion of additional features did not improve the regression model, we rethought our decision to use Regression and decided classification would give us more accurate insights into the prediction. We reclassified our TSLA stock data to represent a positive, negative, or neutral change on the day. We then ran a decision tree classifier, which classified 49% of the stock fluctuations correctly for the test set- a slight improvement from our regression output. Here are some additional metrics that we calculated to get more insight into the accuracy of our classifier:
Mean Absolute Error: 1.015
Mean Squared Error: 2.030
Root Mean Squared Error: 1.425
Results
It is clear that with our existing data it is not possible to establish a strong enough correlation between tweet sentiment and stock return to create an accurate predictive model. We believe this is due to our lack of specific data for TSLA stock. While anecdotally we can see that Musk’s tweets do impact the stock price significantly, we only have the opening, closing, high and low price each day which only allows us to look at average daily tweet sentiment as compared to daily percent change in stock price. If we were able to have closer to minute by minute stock price changes it would allow us to better show a correlation between individual tweets and instantaneously abnormal return of the stock, however as far as we know, no such public data set exists.
Conclusion and Future Work
As aforementioned, while our Naive Bayes Classifier does a good job classifying the sentiment analysis of Elon Musk’s tweets, our Regression model (our initial thought as to how to predict TSLA stock price fluctuation) was not accurate and could not be used to predict stock price fluctuations. While we adapted and created a Decision Tree Classifier model that was a better fit for our data, it still did not accurately predict TSLA stock price fluctuation from the sentiment scores of Elon Musk’s tweets. We can therefore say with the data that we have access to that we cannot use sentiment analysis to predict TSLA stock price fluctuations. However, we believe that with access to more detailed data we could create a better predictive model.
In the future in order to try and establish a true predictive model for the TSLA stock price it would be necessary to collect a higher quantity of data (minute by minute probably) of the TSLA stock price for the hour or so following one of Musk’s tweets. This would allow us to both establish the effect of a singular tweet not just a day of tweets on the price, as well as calculate the instantaneous abnormal return of TSLA following a tweet not just the averaged out daily return that could be affected by many other events, news, or market fluctuations.
Another thing that we would want to focus on in the future is improving the accuracy of the Naive Bayes Classifier. As time goes on we would be able to collect more Twitter data from Elon Musk and use his future tweets in our dataset to help improve the accuracy.
References
[1]Gautam, Geetika, and Divakar Yadav. “Sentiment Analysis of Twitter Data Using Machine Learning Approaches and Semantic Analysis.” 2014 Seventh International Conference on Contemporary Computing (IC3), 2014, doi:10.1109/ic3.2014.6897213.
[2]Goel, Arpit and Anshul Mittal. “Stock Prediction Using Twitter Sentiment Analysis.” (2011).
[3]Short, Robert-Martin. “Pros and Cons of Classical Supervised ML Algorithms.” Rmartinshort, 24 Feb. 2019, rmartinshort.jimdofree.com/2019/02/24/pros-and-cons-of-classical-supervised-ml-algorithms/.
[4]Smailović, Jasmina, et al. “Predictive Sentiment Analysis of Tweets: A Stock Market Application.” Human-Computer Interaction and Knowledge Discovery in Complex, Unstructured, Big Data Lecture Notes in Computer Science, 2013, pp. 77–88., doi:10.1007/978-3-642-39146-0_8.
[5]Tobias. “The Most Important Machine Learning Algorithms.” Semantic Bits, 9 Mar. 2018, semanti.ca/blog/?the-most-important-machine-learning-algorithms.
[SPY-Analysis Data Set] [Tesla Stock Data from 2010 to 2020]